EN |
STATISTICS
control your actions and results
You can access your statistics from the side menu of your indigitall console:
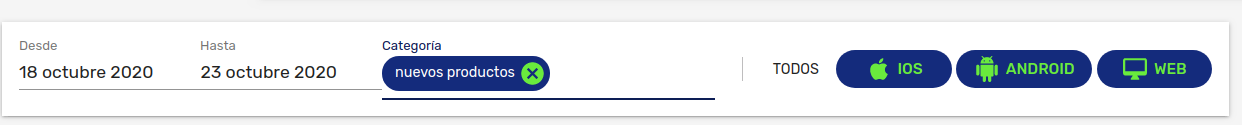
You will find all the information about your campaigns and you can filter both by date and by category .
Puedes You can learn how to group campaigns and organize them by categories in this link.
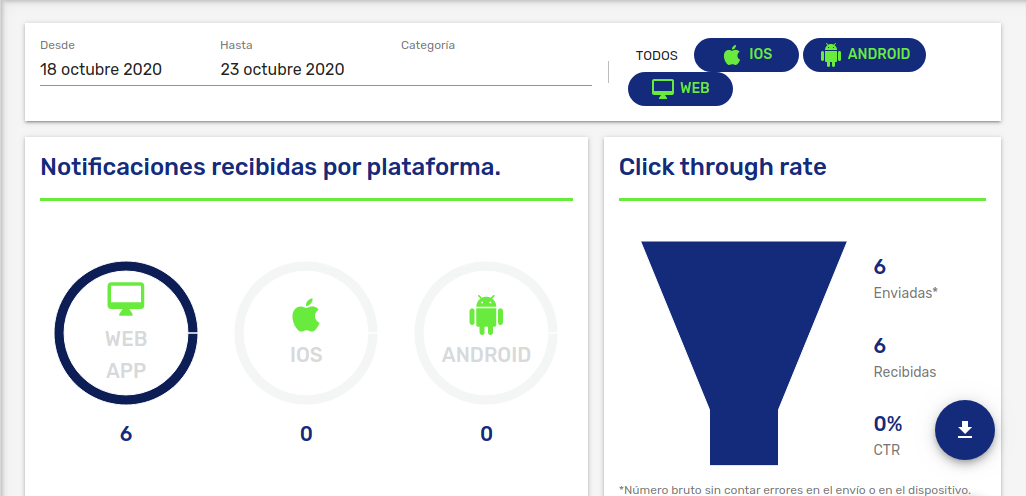
Notifications received by platform - on which platform (web or app) the notifications and their number have been received.
Click through rate - the CTR (click through rate) is the number of campaigns that have been clicked on the total number sent.
Sent: gross number of deliveries not counting errors
Received: number of campaigns that have been received correctly.
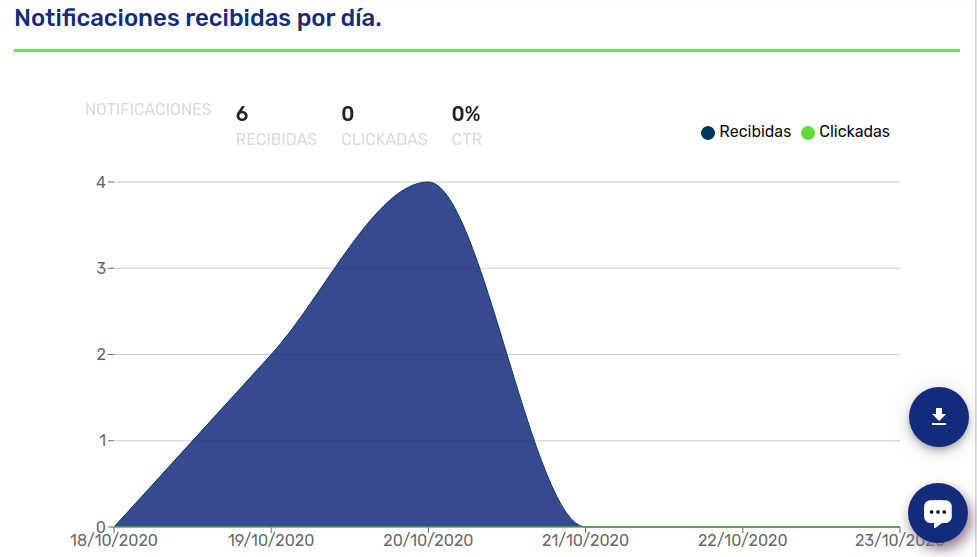
Notifications received per day - graph with data of notifications received and clicked per day.
Download statistics - in the lower right side button you can download your statistics in .csv format